
Mind the Gap 2016
What factors lead to better investment timing?
/s3.amazonaws.com/arc-authors/morningstar/fcc1768d-a037-447d-8b7d-b44a20e0fcf2.jpg)
A version of this article was published in the May 2016 issue of Morningstar FundInvestor. Download a complimentary copy of FundInvestor here.
Investor returns are dollar-weighted returns, as opposed to time-weighted returns, which are the standard way of displaying an investment's total returns. We calculate investor returns for a single fund by adjusting returns to reflect monthly flows and their compounding effect over time. Generally, investor returns fall short of a fund's stated time-weighted returns because, in the aggregate, people tend to buy after a fund has gained value and sell after it has lost value. Thus, they miss out on a key part of the return stream.
That fact plays out for all types of investors--not just fund investors. Studies show stock investors and pension fund managers do the same thing. Who really was there to buy
To aggregate fund investor return data, we roll up the figures by asset-weighting them so that big funds count for much more than little ones. Then, we compare the asset-weighted number to the average fund's total return. Essentially, we are comparing the average fund to the average investor experience. The gap between the two figures tells us how well investors timed their investments in the aggregate. Exchange-traded funds were not included because it is difficult to estimate flows into them.
I discuss the study with Morningstar's Christine Benz in this video.
How Are Investor Returns Useful? Generally, it is more useful to look at the forest than the trees when it comes to investor returns. Taken as a whole, they tell us something interesting about aggregate investor behavior. But individually, it can get pretty noisy. While investor returns often tell an interesting story of how a fund is used, be careful about reading too much into an individual fund's investor returns.
Take two similar funds launched at different times and you may find very different investor returns. It's a good idea to find out why the fund was used poorly or well. It helps to look at that return gap and then look at calendar-year performance for the fund. Usually the answer can be found in the first two or three years of the time period. Maybe a fund had a great year that led investors to rush in too late, or, conversely, a fund closed to new investors was able to hold on to longtime shareholders through a difficult year, thus enabling them to reap the benefits beyond that year.
Backing out to the forest view, we can test various factors to see which ones have a link to better investor returns and which ones don't. These may be the most obvious lessons for what we should look for in a fund and what behavior can be self-destructive.
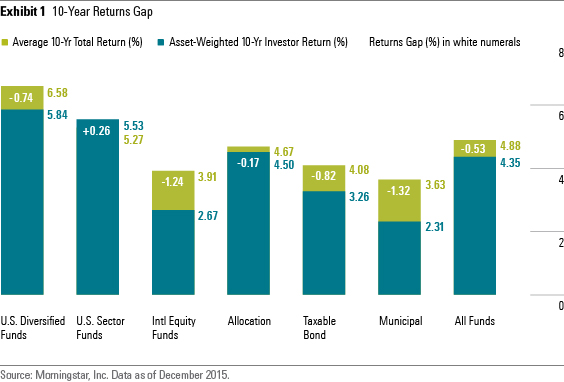
What the Data Says For the 10 years ended December 2015, the investor returns gap shrank from the average over recent years. For U.S. equity funds, the gap was 74 basis points, but international funds had a much wider gap of 124 basis points. Municipal-bond funds continue to be the most confounding group, with a big 132-basis-point gap, while taxable-bond funds had a more moderate 82-basis-point gap. As usual, allocation investors fared the best, with a gap of just 17 basis points.
More telling than the latest batch of data is the average annualized gap for 10-year periods ended 2012 to 2015: negative 1.13%. That smooths out some of the issues with end-date bias to illustrate just how much we cost ourselves through bad timing moves.
Flows were strong across the board at the beginning of the 10-year period. Flows were particularly strong into foreign and domestic equity because equities had rallied off the lows of the bear market that ended in 2002. Some of that money later left in 2008 and 2009 as skittish investors sold near the bottom, but that initial wave of good flows and a return to equities after 2009 seemed to have ensured pretty good results.
Allocation funds enjoyed steady inflows throughout, so, while some dumped their equity funds at the wrong time, many maintained and added to equity exposure through allocation funds. In addition, target-date funds are part of the allocation group, and they consistently show investor returns that are superior to time-weighted returns. For one, target-date funds have sufficiently moderate returns to avoid scaring shareholders away while not attracting hot money. In addition, target-date funds are mostly held in 401(k) accounts where investors buy with every paycheck. Although they could still panic and sell at the wrong time, most investors ride out the downturns. It does not require a target-date fund, though, to invest like those who do. Systematic investing and rebalancing is a great way for investors to stick to their plan through thick and thin.
It's surprising that the rather stable muni-bond fund group could be so misused, but it has been going on for a while. The problem here is that there are very risk-averse investors and a sector with scary headlines. The good news rarely makes headlines. Rather, investors hear about Puerto Rico's crushing debt and Meredith Whitney's ill-informed doomsday call. Those news events spurred muni investors to sell, which led to a drop in muni-bond prices and a spike in yields. Thus, they created a buying opportunity just as investors were fleeing. This speaks to the downside of trying to time the market and the benefit of staying focused on the long term. Oddly, sector funds did quite well as investors had good timing in some real estate, utilities, and communications funds.
Some Factors That Affect Investor Returns What factors can have an impact on the returns that the typical dollar invested in a fund earns? We put a few of those factors--including fund stewardship grades, standard deviation, tracking error, and expense ratios--to the test. In each case, we began by breaking funds into quintiles based on how they stacked up five years ago on the factor concerned. Then we looked at the pattern of investor returns in each quintile five years later. In some cases, we sorted into quintiles within a category and in other cases within the broad asset class.
The results are intriguing, though investor returns data is a bit noisy.
Stewardship Grades We grouped funds by their Morningstar Stewardship Grades from A to F. Unlike the other data points, this one doesn't lend itself to even distribution because there were more C stewards than anything else and particularly few Fs. When we looked at the breakdown across all funds, we found that A stewards had asset-weighted investor returns of 7.12% annualized and a gap of 0.18%; B stewards had an annualized return of 6.91% and a gap of 0.18%; C stewards had a 5.99% annualized return and a gap of 0.05%; D stewards had an annualized return of 5.06% and a gap of negative 0.77%; and F stewards had a 5.19% annualized return and a gap of 2.59%. It's worth noting that only 40 funds had an F stewardship grade at the beginning of the period and only 35 were still around at the end, so we have a small sample for the Fs.
Why the link between stewardship and better investor returns? It would appear a few factors are at work. First, savvy investors tend to find their way to shareholder-friendly fund companies, so it makes sense that they would use their funds a little better. Second, the better stewards tend to have lower fees. Third, the better stewards are more careful about fund launches and more forthright in setting investor expectations.
Takeaway: The more shareholder-friendly the firm, the less likely investors are to get whipsawed in the funds they offer.
Standard Deviation We grouped funds by three-year standard deviation in two ways--by category and by asset class. When we ranked by category, we found that the most volatile quintile of U.S. equity funds had worse investor returns and a bigger performance gap, but there was not much of a pattern beyond that. It could be there's no pattern at all, or it could be that within a category, volatility is largely contained in a narrow band and therefore only the extreme funds harm results. When we studied this in the past, we saw the most volatile quintile do worse for investors.
However, the pattern was more apparent when we ranked within an asset class. For example, instead of ranking mid-cap growth funds by standard deviation, we rank all U.S. equity funds against each other irrespective of category. When we did that, we saw positive gaps of 61 basis points, 60 basis points, and 58 basis points for the three least-volatile quintiles. Then, the next two slipped to 7 basis points and 27 basis points. It's a small difference, but perhaps it tells us that absolute volatility is more of a problem than relative. Stepping back from U.S. equity to consider all funds, we see a clear pattern. From the least volatile to the most volatile quintile, the gaps were: 0.81%, 0.42%, 0.13%, negative 0.41%, and negative 1.29%.
Takeaway: The more volatile a fund (when compared with others in that asset class), the harder it's likely to be for investors to handle.
Tracking Error Tracking error differs from standard deviation in that it measures the extent to which a fund's returns vary from its assigned benchmark index. In other words, there can be two funds that have wildly different standard deviations--say, a growth equity fund and a short-term bond fund--but that have similar tracking errors. On the other hand, there can also be two funds that have starkly different tracking errors but experience the same level of volatility.
When we tested by tracking error, we found a pattern for our relative rankings but not for absolute rankings. Within U.S. equity, the gap for the first four quintiles was largely similar, ranging between 40 basis points and 57 basis points. But the highest tracking-error group had the sole negative gap of 31 basis points. The pattern was stronger for all funds as it moved from 82 basis points in the lowest tracking-error quintile to negative 0.92% for the fourth quintile and negative 0.49% for the highest tracking-error group.
While it's pretty easy to understand why high volatility or high fees would have a negative impact on investor returns, the impact of tracking error is less clear. The issue may be that when funds are different from the broad benchmarks, investors will give up on them when they lag by a wide margin. We saw that during the dot-com boom in 1999 and 2000 when investors gave up on small-value funds even though their returns were positive and volatility was low because large-cap tech stocks were posting massive gains. As a result, investors missed the rebound in small-value funds when the dot-com bubble burst.
Takeaway: Investors should know what they own. Some funds are not going to track the broad markets either because they invest in a different area, are focused, or are designed to be low-risk. If investors understand that going in, they won't overreact when some of these holdings lag in a broad rally.
Expense Ratio As in prior tests, fees seem closely linked with the investor experience. Investors in the cheapest quintile of U.S. equity funds enjoyed a subsequent return of 11.15% and positive gap of 0.17%. Meanwhile, those in the priciest quintile settled for returns of 7.36% and a gap of negative 1.37%. This is similar to what we've seen before and what also has been found by Jason Hsu of Rayliant Global Advisors: When breaking down investor returns by fees, the difference is even wider than the difference in fees. This could be due to savvier investors using low-cost funds, or perhaps by the availability of lower-cost funds in retirement plans (which receive steadier investor inflows). In addition, low-cost funds create a positive feedback loop for investors, in that they're likelier to yield good outcomes, which, in turn, ensures investors stay put. Contrast that with high-cost funds, which succeed far less often, forcing investors to change and, in so doing, potentially mistiming their investments.
For all funds, the average investor in low-cost funds enjoyed a 6.50% return while the average investor in high-cost funds settled for a return of 3.43%.
Takeaway: Even after accounting for price differences, cheaper funds have smaller investor returns gaps than costlier funds.
:quality(80)/cloudfront-us-east-1.images.arcpublishing.com/morningstar/OMVK3XQEVFDRHGPHSQPIBDENQE.jpg)
:quality(80)/cloudfront-us-east-1.images.arcpublishing.com/morningstar/WJS7WXEWB5GVXMAD4CEAM5FE4A.png)
:quality(80)/cloudfront-us-east-1.images.arcpublishing.com/morningstar/NOBU6DPVYRBQPCDFK3WJ45RH3Q.png)